Large, diversified portfolio of high-quality real estate
Our asset management teams in the U.S. and Europe are dedicated to proactively managing our portfolio and working with our tenants to ensure they have the real estate they need to meet their evolving business objectives.
Geographic
Property Type
Tenant Industry
Top Ten Tenants
Our top ten tenants represent 18.3% of ABR and have a weighted average lease term of 13.7 years.
For more information on our top 25 tenants, see our IR presentation.
1. Extra Space Storage
43 net lease self-storage properties in the U.S.
Total Base Rent (%): 2.7%
Lease Term (Years Remaining): 23.4

2. Apotex
11 pharmaceutical R&D and advanced manufacturing properties in Canada
Total Base Rent (%): 2.1%
Lease Term (Years Remaining): 17.0

3. Life Time Fitness
12 health and fitness facilities in the U.S.
Total Base Rent (%): 2.0%
Lease Term (Years Remaining): 7.6

4. Metro Italia
18 business-to-business retail stores in Italy
Total Base Rent (%): 1.8%
Lease Term (Years Remaining): 5.1

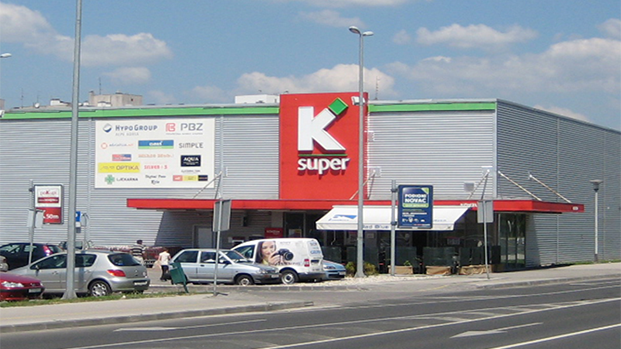
5. Fortenova
19 properties, including grocery stores and one warehouse, in Croatia
Total Base Rent (%): 1.8%
Lease Term (Years Remaining): 8.1
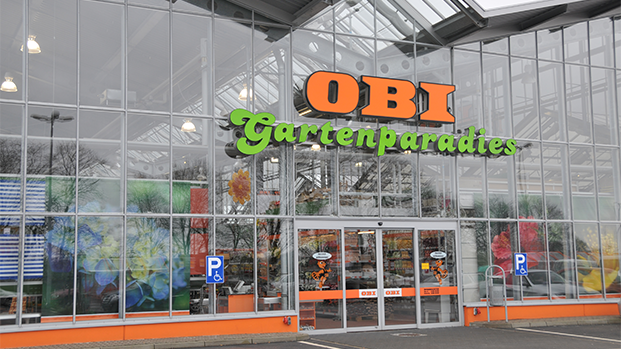
6. OBI
26 DIY retail properties in Poland
Total Base Rent (%): 1.7%
Lease Term (Years Remaining): 7.9
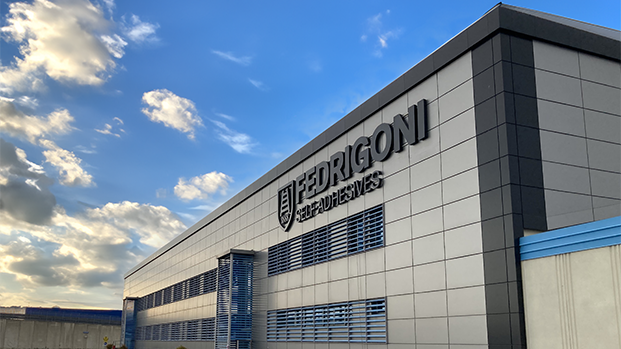
7. Fedrigoni
16 industrial and warehouse facilities in Germany, Italy and Spain
Total Base Rent (%): 1.6%
Lease Term (Years Remaining): 17.7
8. TI Automotive
20 automotive parts manufacturing properties in North America
Total Base Rent (%): 1.6%
Lease Term (Years Remaining): 18.9
9. Eroski
63 grocery stores and warehouses in Spain
Total Base Rent (%): 1.5%
Lease Term (Years Remaining): 10.0
10. Nord Anglia
3 K-12 private schools in the U.S.
Total Base Rent (%): 1.5%
Lease Term (Years Remaining): 18.5

Portfolio Map
Portfolio information reflects pro rata ownership of real estate assets (excluding operating properties) as of March 31, 2026.